Industry report
Overview of Apps Statistics, Usage & Downloads (2020 report)
Apps Statistics, Usage & Downloads (2020 report)
A lot of commercial activities are happening through mobile applications, and it plays a dominant stake in business conversion. From the consumers, retailers, workers, homemakers, the apps have captured the world with the technological advantage of the smartphone. Most of our online shopping, reading, listening, playing, or even communication has been majorly accomplishing by smartphones that are controlled by the applications. Your handset comes with an application suitable for every use, or you can find out an appropriate app for meeting your requirements.
Now, as a company or marketing strategist, you need to be aware of the precise data in order to properly incorporate video marketing into your campaigns. Needless to say, creating video requires resources, so an optimized video campaign will use all types of marketing techniques, including text and image based content.
In order to help you make the right decisions, we have put together a comprehensive list of some useful and actionable statistics and facts on video marketing in 2019. You will get a quantitative idea as to how videos are affecting web traffic, business decisions, consumer habits, and different online and social platforms. So without further ado, let’s get started:
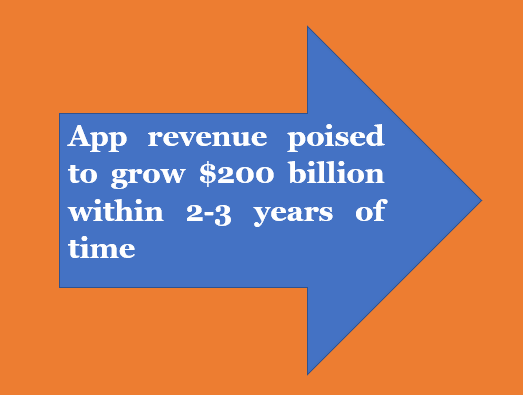
As per some survey reports, the growth of application development and application usage shows an upward trend with very month. The growth rate remains to continue and soon, shall cross a revenue of $200 billion within 2-3 years of time. Regardless of one being a general user, a marketer, developer, or any individual, must be aware of its statistics in today’s time. Let’s look at some basic pointers to understand the App usage statistics from the recent reports.
- A sharp decline in desktop-based internet usage, but mobile internet usage is increasing every day.
- Users have downloaded approximately 178 billion applications in the year 2017, and the numbers continue to increase ever since.
- Mobile applications have been predicted to hit $189 billion in revenue by the year 2020, as per the usage statistics.
- Around 25% of all the mobile applications are game applications, makes it 2.5 times higher the number than of business applications.
- Out of every user, at least 70% of the users reported having game applications on their phones.
- As per the survey, smartphone users spend around 40% of their ‘mobile application’ time by using social networking or surfing music applications.
- Millennials had spent most of their application time on Amazon, Gmail, and Facebook. These are the three most frequently used applications throughout the day.
- As per the 2017 reports, teenagers (18-24-year-old) spent 66% of their time in watching digital media contents by using smartphone applications.
- Though the mobile website gets more visitors than the application, users still spend more time on the mobile app than the mobile website.
- The growth of smartphone users worldwide are expected to touch roughly 7 billion by 2021.
- By 2022 the annual mobile application downloads will reach 258 billion, which will be 45% more than of 2017.
- As of today, the average time spent by any user on a mobile application is 3 hours and 45 minutes roughly.
- 79% of the smartphone users uninstall the application the same day due to various reasons. Every application crash costs 71% of uninstalls for that particular application.
- As per the reports, at least 87% of the smartphone users check their phone 65 times a day, an hour before they sleep while 69% of the users usually check their phones within 5 minutes before they go to bed.
The most common statistics of the application data usage:
- Many users believe in relying on the secured applications stores like Apple App Store, Google Play and Windows Store than having an external Kpi for downloading any apps.
- Applications get introduced to the users via word of mouth. Users commonly download it when they hear about it from friends or colleagues or if they happen to see it on a website.
- People use a smartphone with social media applications.
- On average, users spend most of their time using 6 or fewer applications; the rest of the time, they use social media accounts.
- As per the reports, people use favorite applications at least 21 to 30 times throughout the day.
- Many people are reluctant to share personal data, location, or contact details with the applications.
- Users only tend to delete the application when they don’t use it or don’t need them anymore. It has found that many applications kept unused for an indefinite period before being deleted.
- Once deleted, about 12-15% application get re-downloaded, merely because the user felt it to have or if they accidentally deleted it.
Time spent on mobile by the users:
- 94% of IT professionals expect that the number of mobile security attacks will be more frequent in the future than it is today. To avoid such a possible breach, the security and privacy features of the mobile phones have enhanced.
- As per the 2017 report, the average time spent by a user on mobile was 223 minutes.
- Approximately 46% of users dropped the idea of using an application or keep it on their device due to its poor performance. The devices didn’t have the technological features to support the functionalities of the application or store massive files or applications, resulting in users to uninstall the application in less than 10 seconds.
- Since Google has been dominating the search engine, it is also held responsible for 96% of all the smartphone search traffic.
- Digital audience as per these application statistics comprises of 16% male and 22% female audience.
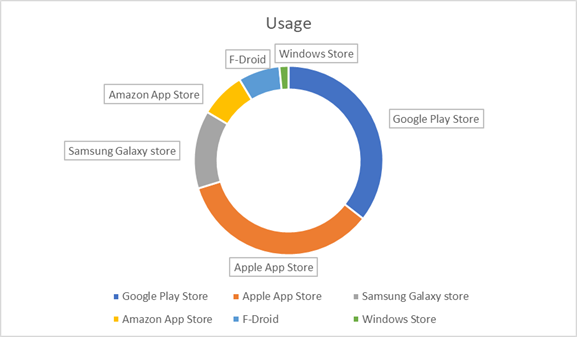
Which app store has the highest number of users in smartphones?
Hands down, more users visit and use Google Play Store than Apple and Windows Store because of the customization advantage Android offers.
Now let’s look at some detailed Mobile Application statistics:
Ø The mobile application users stand at 3.5 billion at the beginning of 2019.
Ø Every individual is reported to have spent at least 69% of their media time on smartphones using the favorite applications.
Ø Even though the market rose to the point of having an application for almost every need, users are still reported to be using approximately 15-20 applications monthly, 8-9 applications daily. The apps they use include the application they use daily.
Ø By 2020, smartphone users across the globe are expected to cross 2.87 billion.
Ø As per the report in 2018, 61.3% of the population was having access to the internet via mobile phones.
Ø Mobile devices are close to driving 80% of online traffic.
Ø The 2018 reports state that up until the 4th quarter, over 2 million applications were available, which represents a 3.14 percent decrease in the mobile app when compared to the previous quarter.
Ø Mobile applications are seeing a dip in their statistics due to the fraudulent transactions that have happened over applications, security concerns, and having to share the cellular data with the developers of the app.
Ø As of 2017, reports have mentioned having witnessed 197 billion downloads of mobile applications, and now the total number is expected to increase by up to 258 billion by 2020.
Ø Google Play has around 167% of more free applications that any other App store.
Ø Majorly 62% of the paid applications are priced between $0.999 and $2.99.
Ø Out of the available applications, only 83 paid apps in Google Play Store enjoys 1 million downloads.
Ø Minimum 9% of all the applications offer an in-app subscription enabling method.
Ø Most downloaded apps are gaming apps.
The type of applications preferred majorly by user:
Users have shown more interest in game applications over other apps. Let’s look at the graph below to understand better.
App Usage and Trends as of 2019:
As per the current statistics, there is a list of forecasting that conveys how 2020 will look like in terms of application uses and the trends will it bring or change in the current industry. Let’s look at some underlying factors.
- The third quarter statistics of 2019 show approximately 2.47 million apps on the Google Play Store and 1.8 million apps on Apple Store. As per the current spurge of applications hitting on the online store, the market will get flooded with more apps by 2020.
- There will be more free downloadable apps in 2020. As of today, 95% of Android apps and 90% of iOS apps are free to use. People do not wish to pay for an app until it becomes inevitable for daily use.
- As per the industrial forecasting, by 2020, the revenue from the mobile application will be $189 billion.
- Since the applications are free, the service of in-app purchases generates maximum revenues for the companies. It is expected to shoot up to $201 billion by 2021, by just the in-app purchase feature.
- The application downloads are global. 64% from APAC region, 19% from EMEA, and 17% from AMER; however, China accounts for nearly 50% of global app downloads, whereas India is leading the list, followed by USA and Brazil.
- Social Media will always top the charts. As per the report, WhatsApp topped the list with 223 million installations followed by Messenger (Facebook) with 209 million installs.
- TikTok is and shall continue to top the charts, as per the report. It is the fastest growing social media platform which has grown its download to 70% within a year of its launch
- Global Mobile Gaming is expected to rise in 2020 by 57% than its original market share. The inception of Internet speed 4G and 5G will now boost the cloud gaming service and will make way for mobile gaming to take over in no time.
- As per the reports of 2019, by 2020, it is expected to have 6.95 billion mobile users worldwide. In the coming years, people of ages between 16 to 24 will be the ones taking over the market because they are born in the smartphone and internet era, where mobile devices are a common thing in everyday life.
- Virtual reality on mobile phones, with the help of applications, are now a possibility by 2020 as the API fixings are underway. It will revolutionize the visual media, and the application that provides fun and graphic will rule the market.
- OTT platforms like Netflix, Amazon Prime, etc., have also driven most of the users on their mobile applications. Their current traffic is 45%; however, it is expected to reach 60% and beyond by 2020.
- As voice search has started its appearance in all major applications, the module is expected to generate 100 million smartphone users by 2020.
- Users who prefer watching videos or use application that promotes the same is expected to reach 179 million in 2020.
- 34% of market-driven applications are focusing on enabling the voice app by 2020
- 83% of enterprises will now have their workloads in the cloud by 2020.
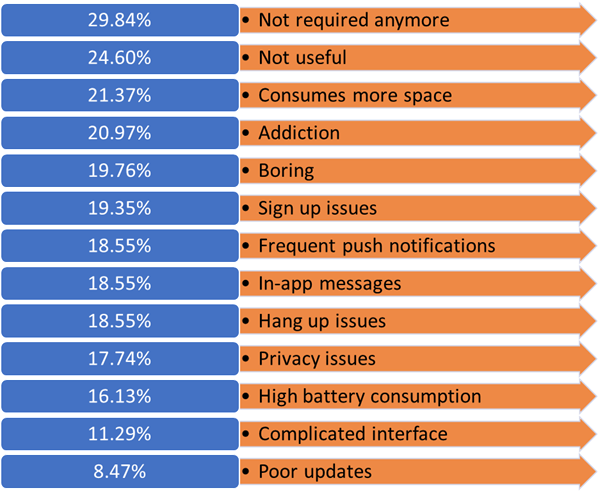
Reason to uninstall mobile app:
Highlighted Mobile App Statistics:
- The mobile apps can generate a revenue of $189 million by 2020.
- 2.8 million apps are available in the Google Play Store as of now.
- 28 million apps are available in the Apple Store.
- 49% of people use an app more than 11 times per day.
- More than 57% of digital media engagements are by mobile apps.
- 21% of millennials use more than 50 times an app per day.
- 30 apps per month are the average usage of a smartphone owner.
Popular Apps and its mobile usage time based on 2019 survey:
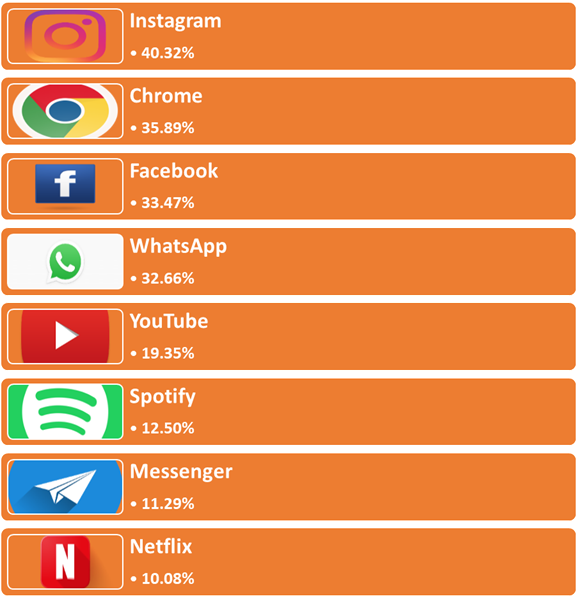
The trends in the app segment are very positive. All most all services and commercial activities are gradually inclining towards introducing new apps, upgrading existing apps, and ease up the interface. Mobile users will be highly depending on apps for essential services and online commercial activities. The statistics and forecast trends imply that more people will rely on apps for various daily requirements.Conclusion:
The communication technologies show tremendous advancement, and with the introduction of 5G technology, there will be significant developments in the way how we communicate and engage with applications. For meeting the challenges of contemporary times, all apps need to get tuned to accommodate the demand of the changing time. Modernization, changes, innovations happen daily, and accordingly, the expectations of the consumers also very high.
The annual app download will increase multi-fold. By 2021 the projected mobile app download will touch about $353 billion. It shows the growing demand for application and the need continue to surge over the years. It is a new reality, and as a result, more players are entering into developing applications suitable for various online activities. The future of apps, especially the future of mobile apps, are very promising, and the possibilities are unlimited.
Reference links:
https://clearbridgemobile.com/stats-for-mobile-app-growth-and-success/
https://www.mindinventory.com/blog/mobile-app-growth-statistics-2020/
https://themanifest.com/app-development/mobile-app-usage-statistics-2018
https://www.peerbits.com/blog/top-mobile-app-development-trends.html
https://www.goodfirms.co/resources/app-download-usage-statistics-to-know
More To Explore
Wearable Statistics And Facts For 2021
Industry report Overview of Wearable Statistics And Facts For 20211
Facebook live Statistics, Usage And Facts (2020 Report)
Industry report Overview of Facebook live Statistics, Usage And Facts
Web Hosting Statistics, Market share And Facts For 2021
Industry report Overview of Web Hosting Statistics, Market share And
Explore Related reccomendations
Facebook live Statistics, Usage And Facts (2020 Report)
- According to 0 users
Telegram Revenue and Usage Statistics 2020 report
- According to 0 users
Magento Statistics, Usage, Marketshare 2020 (report)
- According to 0 users
TikTok Statistics, Usage And Facts (2020 Report)
- According to 0 users


