Mobile Vs Desktop Internet Usage Statistics 2021

The development of technology is a continuous process, and it plays a significant role in our daily life. Technology that you use today might become redundant in a few months later. Fast developments are happening in the world of both mobile devices and desktops. Usage statistics of mobile devices and desktop shows the high volume of penetration and the impact it creates in our lives. Let us do a comparison study of mobile devices with desktops and find out which one has the edge over the other as per the available statistics of 2019.

Statistics reveal that mobile usage has significantly outsmarted desktops far behind, and mobile device usage shows a significant growth trend. The upward trend will remain there as people are increasingly turning to mobile devices like smartphones and tablets for online activities.  In the last 5 years, mobile traffic has increased significantly by 222%. The contribution of mobile traffic in the online world was only 16.2% in 2013. The mobile utility share has risen to 52.2% by 2018.

Key Stats:

  • Mobile traffic has increased by 222% in the last seven years
  • 52% of the world’s web traffic comes from a mobile device
  • Mobile searches surpassed desktops searches from 2015


Statistical Comparison of Mobile devices and Desktop Usage

The share of mobile devices in the online world is increasing and is not limited to a single segment of the internet.  Social media usage, search volumes, e-commerce, and all online activities show a growing shift towards mobile devices compared to desktop.  Let’s examine how mobile devices and desktop has fared in various categories of online usage.

  •        In 2018, mobile phones generated 52.2% of worldwide website traffic.

    ·         The expected mobile internet usage in 2019 is 80%.

    ·         The global mobile devices traffic in 2018 was nearly 14.9 exabytes per month. During 2018-2021, the global mobile device traffic is expected to increase by almost three times.

    ·         Mobile devices also capture 65% of all digital media time. Desktop enjoys a significant share of time spent on social media while mobile devices lead in business, finance, and news.

    ·         The worldwide mobile devices market share is 52.1%, while desktop market share is 44.2%.

    ·         In 2015, users spent 59% of their time on mobile devices, and 41% spent their time on desktops. 

Usage statistics of mobile and desktop devices

As per global projections, an estimated 63.4% of global internet users will be accessing the web through their mobile devices in 2019. The upward trend of mobile usage is very high in developed and developing countries. China has a total of 802 million internet users, of which 98% use mobile devices. India is right behind having 502 million internet users, of which 80% use different forms of mobile device uses. Below given statistics demonstrate the growth of mobile device usage comparing to the desktop.

  •         63% of online traffic in the US happens with smartphones

    ·         The average bounce rate of mobile devices is 45%, and for desktop, it is 38%.  It shows a remarkable decrease in the bouncing rate comparing to mobile devices, which was 52% in 2016.  When we compare the bounce rate with the desktop, it remains the same as in 2016.

    ·         Out of the total page view in the US, the share of mobile devices was 53% in 2017. It shows an increase compared to 2016, where it was 41%.

    ·         In the 2016-2017 period, the average page views per visit for mobile devices increased by 21 % in the US while it was flat for desktop during the same period. The statistics show the increasing popularity and shift of people’s preferences towards mobile devices for browsing.

Though mobile devices outsmart desktop in terms of usage, desktop still leads when it comes to engagement. People spend more time on sites accessed through desktop than through mobile devices.

Search statistics – what the devices used for searching?

Search statistics also show that most searches are being carried out on mobile devices than desktop.  Even the ad revenue from mobile searches has been increasing compared to the ad revenue from desktop searches.

·         An official statement from Google says that 58% of searches globally are from mobile devices.

·         To be more specific, by 2016, 40% of people use only smartphones for searching.

·         Smartphones accounted for 55% of Google ad clicks in Q4 2017, while desktop accounted for 37%.

·         During 2014 – 2019, mobile devices browsing data shows a steady increase in the local search query by using mobile devices in the US. This volume is expected to touch 141.9 billion searches in 2019, which is a 25% increase from 2017. Compared to this, the desktop search query recorded a marginal decrease in the 2014-2019 period, with 62.3 billion searches.

·         The ad revenue from mobile searches in the USA is projected to touch $8.97 billion in 2015 and may reach $21.55 billion in 2022. It is going to surpass the ad revenue from desktop searches in the USA, which is estimated to reach $19.8 billion by 2022.

·         The spending on mobile search advertising in the US was $14.17 billion in 2015, which is expected to increase to $37.43 billion in 2020.


The statistics are very much in favor of mobile devices.  Hence, industries cannot afford to ignore the importance of mobile devices while planning SEO strategies as a significant portion of users are from the mobile sector.

Email and video statistics for mobile and desktop devices

Checking emails are also being increasingly done through mobile devices than desktops.  Also, more and more people are using mobile devices to view online videos.

·         In the US, 61% use mobile devices to check their emails, and 15% use desktop.

·         In Q3 2016, 15% of video views were from mobile devices, especially smartphones. It shows a 233% increase from Q3 2013.

·         Desktop still leads in the total time spent to watch videos and accounts for 59.9% of user’s time while it was only 40.1% with mobile devices.

·         YouTube has more viewers on mobile devices, which stands at 70% of total viewers.

·         Mobile users have also helped to increase the reach of YouTube videos by three times.  After the videos watched by mobile users, each of the 50 leading YouTube channels could extend the reach of the desktop audience by 218%.


·         A Google study shows that more mobile users watched video ads compared to desktop users.  The video ad viewing was 83% among mobile users and 53% among desktop users.

Social media statistics –does it favor mobile over desktop devices?

Mobile device users are leading in the social media segment as well.  This shift is prevalent across all the leading platforms like Facebook, Twitter, Pinterest, and LinkedIn.

·         Mobile devices contribute to 80% of the time spent on social media, while desktop contribution has reduced significantly over the last years.

·         More Facebook users access the site through mobile devices. It accounts for 95.1% of users, and desktop and laptop users contribute to only 31.8% of Facebook access.

·         The time spent on Twitter by mobile devices stands at 86%.

·         Even Pinterest shows a shift to mobile devices, with 80% of users accessing Pinterest through mobile devices in 2016.


·         In 2017, LinkedIn recorded 60% of traffic from mobile devices.

Ecommerce – how mobile and desktop devices fare in this segment?

The e-commerce segment shows a mixed picture.  Though users browse for products through mobile devices, more sales conversions happen through the desktop.  And besides, the trend of online shopping is moving more towards switching between mobile and desktop during the purchase process.

·         The e-commerce conversion rates of smartphones have increased by 64% compared to desktop rates.

·         The retail conversion rate, identified by Adobe Digital index Retail report, is 3 times more in desktop compared to smartphones.

·         By 2020 e-commerce sales through mobile devices will touch 45% of total e-commerce sales in the US and will reach $284 billion. It shows a steep increase from 2014, where the contribution of mobile devices was only 11.6%.

·         Mobile phone usage for online shopping is increasing, with the figures doubling from 8% to 15 % in the 2016-2017 period. In contrast, desktop usage for online shopping dropped from 78% to 63% during the same period.

·         However, browsing through mobile devices does not always translate sales. It is evident from the sales figures we can find from the 2017 holiday season.  Even though 56% of browsing for online shopping was through mobile platforms, the actual contribution in revenue was only 23% for smartphones and only 10% for tablets.  67% of the holiday shopping revenue share, which is equal to $72.3 billion, was from the desktop. 

·         A study by the UK based search engine Skyscanner shows that the searches though mobile contributes to a more significant share of traffic to Skyscanner. Mobile users had 39% lesser chances of them booking a flight online when compared with desktop conversions.

·         Google study shows that 98% of users in the US switch between mobile and desktop on the same day.

·         Channel-hopping is becoming more prevalent in online activities.  86% of global shoppers using both mobile platforms and desktop for shopping.

·         The mobile shopping cart abandonment rate is 97%, and it is 70-75% for desktop shopping carts.

·         The cost of mobile device cost per clicks is 24% less than for desktop, and it has a higher click-through-rate of 40%.


·         The engagement rates of mobile apps are higher than desktops, and the conversion rates are also higher at 100-300%.


Mobile and desktop usage by industry category

The data for different industries shows that mobile users and desktop users vary across various industries.  Adult websites had the most mobile users, with 73% in 2016, and this recorded a steady increase to 84% in 2018. Gambling comes close behind with 66% mobile users in 2016, and it increased to 80% in 2018. The only industries which get more desktop traffic are finance and arts & entertainment. But it has a narrow margin of 52% to 48% for finance and 51% to 49% margin for arts & entertainment.

However, when you consider the time spent by users on various sites, it is interesting to note that desktop users spent more time online than mobile users. In 2018, out of the visitors of arts & entertainment websites, mobile users stayed 7.89 minutes on the sites, while desktop users spent 19.18 minutes on the sites.

News and media section witnessed mobile users spending 3.33 minutes on the websites and desktop users spending 8.08 minutes on sites in the same year. But books and literature industries find more mobile users due to the shift of people’s preference towards reading on mobile devices. Mobile users spent 12.37 minutes on websites, while desktop users spent only 9.56 minutes on websites.


Bounce rates:


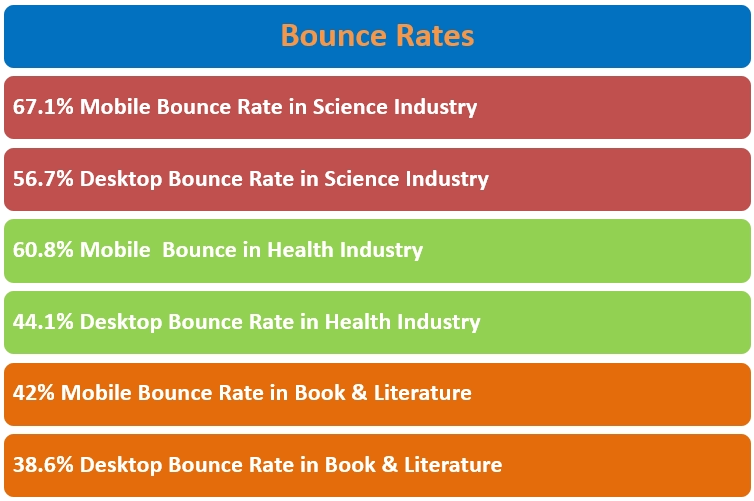
When comparing the bounce rates by industry category, the mobile devices bounce rates are higher than desktop bounce rates in all industries. The mobile device bounce rate in the science industry was 67.1% in 2018, while the desktop bounce rate was 56.7 %. In the health industry, the mobile device bounce rate was 60.8 % in 2018, and the desktop bounce rate was 44.1 %. The difference margin was small only in two categories of industries – books & literature and recreation & hobbies.  Books & literature had 42 % mobile devices bounce rate and 38.6 % desktop bounce rate in 2018, while recreation and hobbies had a 48.3 % mobile device bounce rate and 45.6 % desktop bounce rate in 2018.

Page views:

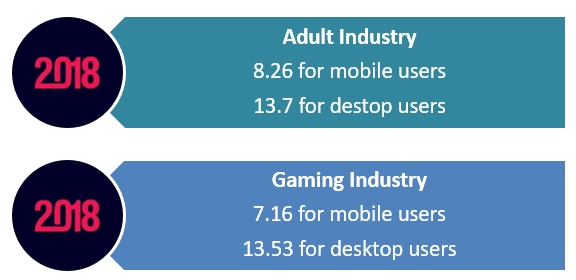
However, the page views for each visitor was higher for the desktop in all industries compared to mobile devices. The average page view of a visitor in 2018 was only 8.26 for mobile users and 13.7 for desktop users in the adult industry. The gaming industry showed 13.53-page views per visitor for the desktop in 2018, while it was only 7.16 for mobile devices. This trend remains the same across all other major industries.

Advantage mobile:

People are becoming more mobile-friendly because of the developments in the field of mobile technology. The increased usage of the mobile device is making it mandatory for marketing strategists to give priorities for mobile-based marketing by focusing on mobile responsive websites.  For capturing the online market, it is essential to develop mobile-friendly applications rather than desktop friendly applications, as the device trends are clearly favoring mobile devices.  When we evaluate the statistics of mobile devices and desktops, the trends are in favor of mobile devices.

Conclusion:

We can find some contradicting and interesting statistics on the results/conversions of mobile vs. desktop devices. While mobile device stands a bit low to desktop engagements, more people access from mobile devices than desktops. But the duration people spent on websites are still high with people who use desktops than mobiles.

It is a fact that people are increasingly using mobile devices than desktops to access sites, and as per the available statistics, the trend will never rescind in the future. Day by day, the number of mobile users to visit the websites are increasing phenomenally. Gradually, the mobile devices may take over the role of desktops shortly. And don’t get surprised if it becomes a reality. Considering these possibilities, digital marketers are all out to capture every opportunity of mobile-friendly marketing techniques.


Source links:

https://www.broadbandsearch.net/blog/mobile devices-desktop-internet-usage-statistics

https://techjury.net/stats-about/mobile devices-vs-desktop-usage/

https://www.smartinsights.com/tag/mobile devices-vs-desktop-usage-statistics/


https://www.perficientdigital.com/insights/our-research/mobile devices-vs-desktop-usage-study

More To Explore

Researched by Brian and SaaS Scout team

This website uses cookies to deliver a relevant and personalized service. By continuing to browse or clicking “Okay, I agree” or "Close", you approve the site's T.O.S and Privacy Policy These cookies are completely safe and secure, and will never contain any sensitive information.